
Audio player docked to bottom

Listen to this article
Introduction: Three Standards, One Goal—Decoding Your Transformer's Health
For asset managers and engineers, interpreting Dissolved Gas Analysis (DGA) results can feel like navigating a complex maze. Three major international standards guide this process—IEC 60599:2022, IEEE C57.104-2019, and CIGRE Technical Brochure 771—and while they share a common goal, their philosophies and diagnostic tools differ significantly.
Rather than viewing them as competing options, a senior diagnostician orchestrates them into a single, powerful unified workflow: Triage for Urgency, perform a Quick Check, and conduct a Deep Diagnosis.
This guide moves beyond a simple comparison to establish that unified methodology. We'll show how to use the IEEE framework to first determine the urgency of a situation, then leverage foundational IEC principles for a quick check, and finally apply the advanced CIGRE-developed graphical tools for a precise and deep diagnosis.
Understanding how to integrate these standards is not just an academic exercise; it is essential for making sound, risk-informed decisions that ensure the reliability of your critical assets while optimizing maintenance resources. As the standards themselves acknowledge, DGA interpretation is a nuanced field requiring both robust data and expert judgment. As stated in IEC 60599:
"Interpretation of DGA results is often complex and should always be done with care, involving experienced insulation maintenance personnel."
This guide distills the core principles of each framework into an actionable, integrated toolkit, empowering you to assess your transformer's health with confidence and precision.
Why rigorous DGA interpretation matters more than ever
The latest global transformer-reliability survey — CIGRE TB 939:2024 (WG A2.62, 66 utilities, 27 countries, 425,294 transformer-years, 1,204 major failures) — adds a sobering operational backdrop to this guide. Across the surveyed population:
- Electrical and dielectric failure modes together account for ~67 % of all major failures (36.3 % electrical + 31.0 % dielectric; TB 939 Table 10, p. 48).
- Windings, bushings and tap changers are the dominant failure locations at 37 %, 25 % and 19 % respectively (TB 939 Figure 26, p. 51). Bushings have roughly doubled their proportional share versus the previous WG A2.37 survey.
- Only ~7 % of failures are currently detected by laboratory DGA or online monitoring combined (3.1 % + 4.0 %; TB 939 Table 15, p. 58). 66.9 % are detected only when the transformer trips on differential protection, Buchholz, over-current or pressure relief (TB 939 §6.3.6, p. 59).
The detection gap is the most actionable finding. Most of the failure modes that dominate TB 939 — partial discharge, arcing, thermal degradation, paper involvement — are exactly what DGA is designed to see before a trip occurs. A structured, standards-integrated workflow is what converts routine DGA data into the pre-trip warnings that survey number implies are still being missed.
1. The Core Philosophy: When Does "Normal" Become "Abnormal"?
The first step in our unified workflow is using a standard to triage the asset's condition and determine the required level of response. A fundamental difference between the standards lies in how they define the transition from normal operation to a potential fault, which directly impacts when an alarm is raised.
IEC 60599 and CIGRE TB 771
These frameworks are built on the concept of "typical values," which are derived from the 90th percentile of gas concentrations found in large DGA databases. Gas formation below this 90th percentile threshold is considered a "stress" or "normal gas formation." When a gas concentration exceeds this single typical value, it indicates a "fault" that warrants further investigation.
Crucially, CIGRE TB 771 builds on this by defining further concentration levels above 'Typical,' including 'Intermediate 1,' 'Intermediate 2,' and 'Pre-failure (PF)'. This provides a more nuanced scale for assessing fault severity, even if it doesn't have the explicit action-oriented 'Status' levels of the IEEE guide.
IEEE C57.104-2019
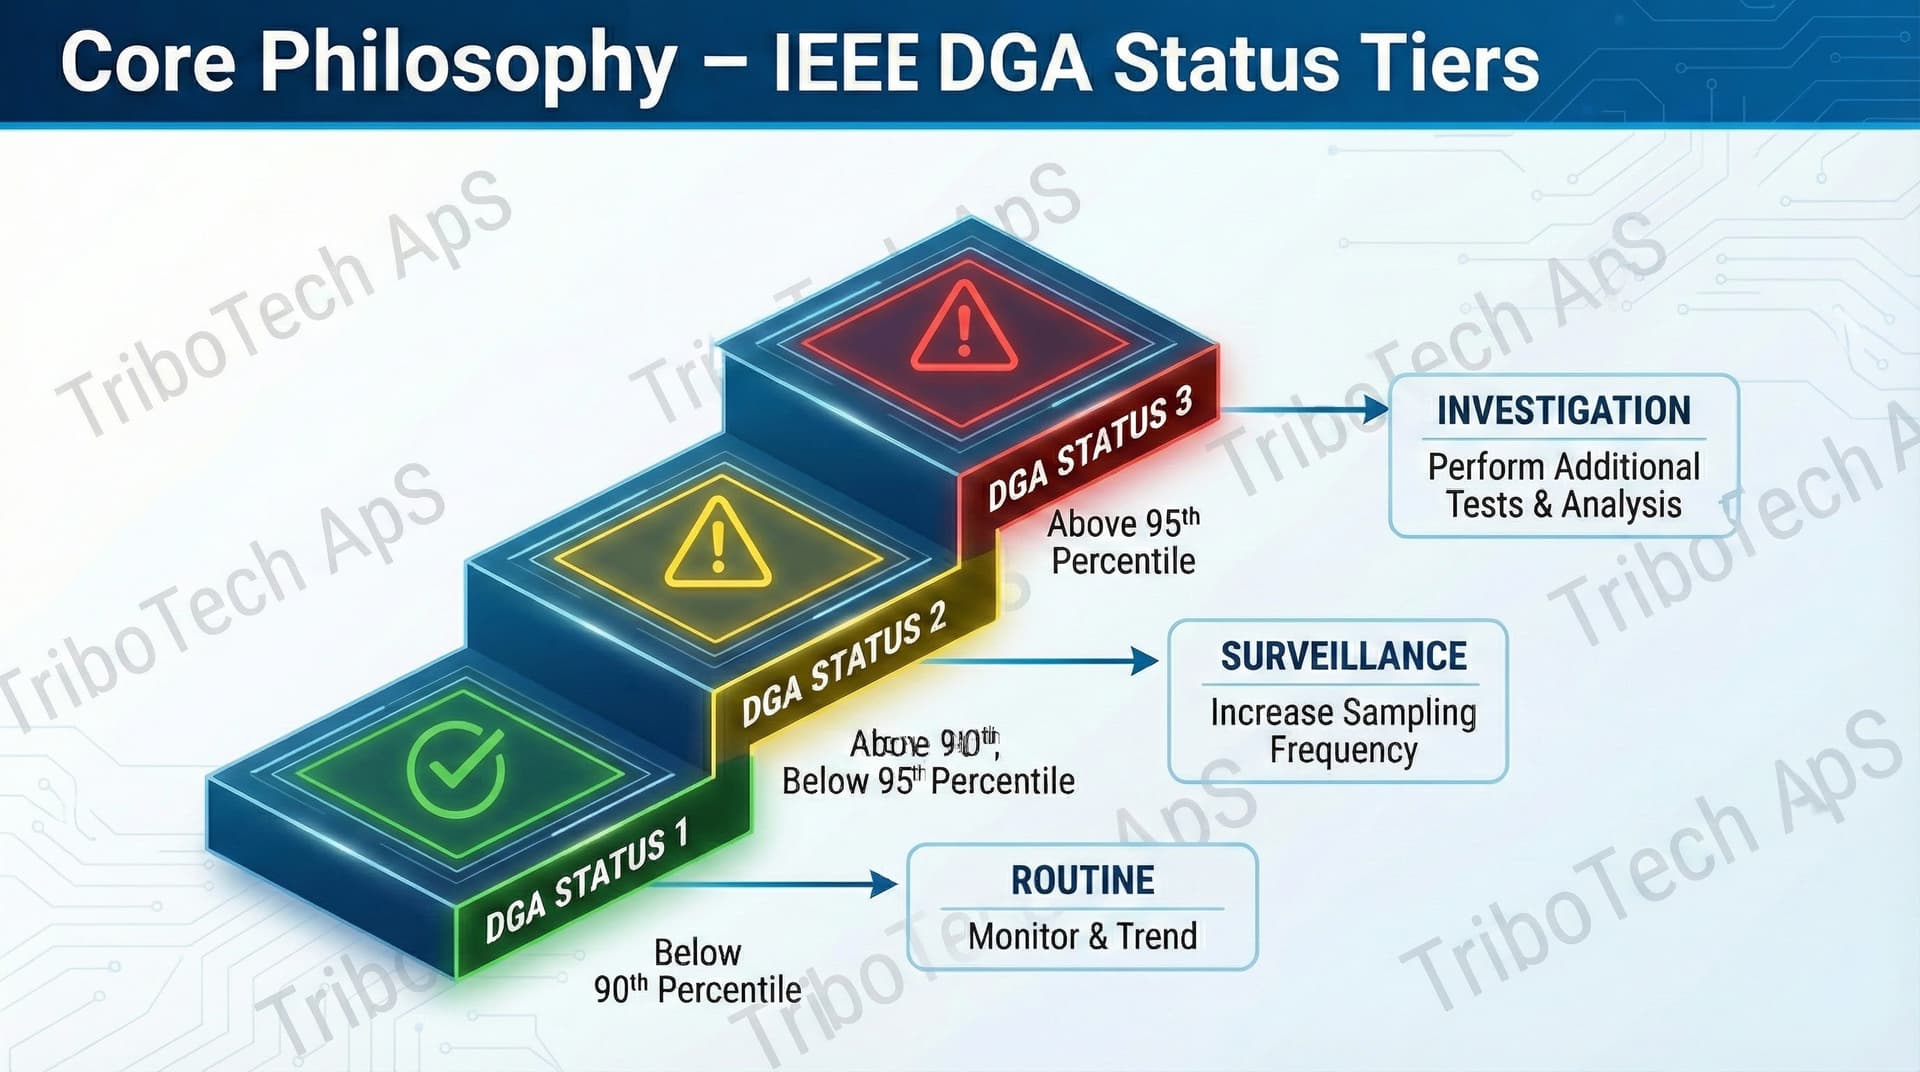
The IEEE guide uses a tiered system known as "DGA Status" to classify results, providing a staged approach to escalating responses:
- DGA Status 1: All dissolved gas concentrations are below their respective 90th percentile norms (from Table 1 of the standard). This is a normal operating condition.
- DGA Status 2: At least one gas concentration is between the 90th and 95th percentile norms. This signals a need for increased surveillance, such as more frequent sampling.
- DGA Status 3: At least one gas exceeds its 95th percentile norm. This status requires a comprehensive fault identification and transformer assessment process.
The IEEE Status system provides an invaluable management framework that the other standards lack. It creates clear, defensible triggers for escalating action—from continued routine monitoring to heightened surveillance—preventing both premature panic and costly inaction. It answers the crucial first question: 'How worried should I be?'
This is why it serves as the primary tool for triage in a modern diagnostic workflow. It is crucial to remember, as IEEE C57.104-2019 cautions, that this status reflects the gas data, not necessarily the transformer's overall condition.
"Therefore, the methodology presented here will classify the DGA results, not the transformer condition. Users should not equate 'DGA status' to 'transformer condition.'"
2. Identifying the Culprit: Fault Classification Systems
Once a potential fault has been detected, the next step is to identify its nature. Each standard provides a system for classifying faults, with CIGRE and IEEE offering a more detailed, granular approach essential for accurate diagnosis.
IEC 60599
This standard defines six basic fault types that form the foundation for DGA diagnosis:
- PD: Partial discharges
- D1: Low-energy discharges (arcing)
- D2: High-energy discharges (arcing)
- T1: Thermal fault at temperatures <300°C
- T2: Thermal fault at temperatures between 300°C and 700°C
- T3: Thermal fault at temperatures >700°C
CIGRE TB 771
CIGRE expands on the IEC model by introducing several critical thermal fault sub-types, allowing for a more precise diagnosis:
- S: Stray gassing of oil (gas formation not related to a fault)
- O: Overheating (<250°C) without carbonization of paper
- C: Carbonization of paper insulation
- T3-H: High-temperature thermal fault in the oil only (not involving paper)
IEEE C57.104
The IEEE guide also utilizes the six basic IEC fault types but fully incorporates the advanced CIGRE sub-types. It does this by recommending the use of the complete suite of Duval graphical tools, which are designed to distinguish between these more specific fault categories.
This granularity is critical. In the field, the ability to differentiate stray gassing (S) from a potentially dangerous fault like paper carbonization (C) is often the deciding factor between routine monitoring and an emergency shutdown.
3. The Analyst's Toolkit: From Ratio Tables to Graphical Methods
The diagnostic tools recommended by each standard have evolved significantly, with a clear trend toward more powerful and intuitive graphical methods. This is where we execute the "Deep Diagnosis" phase of our workflow.
IEC 60599
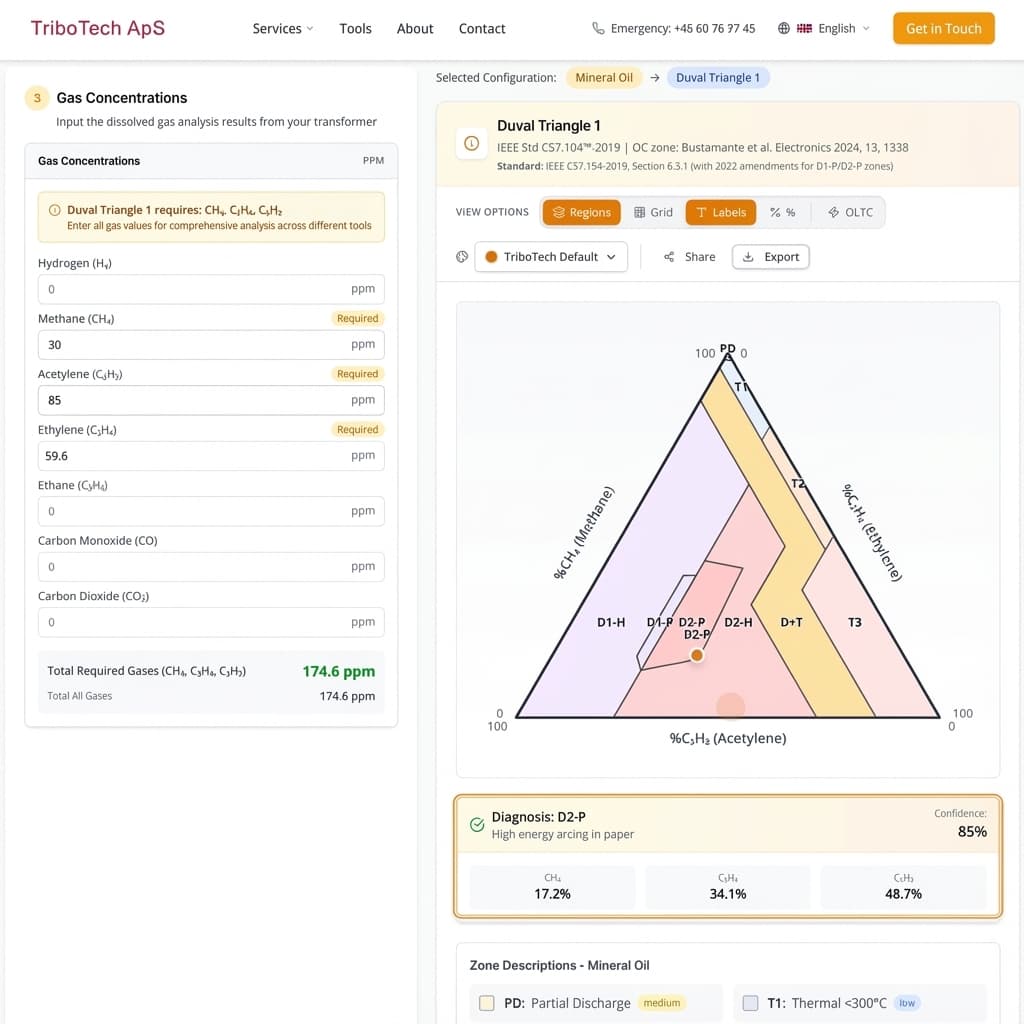
The foundational method in the IEC standard uses Basic Gas Ratios (C₂H₂/C₂H₄, CH₄/H₂, C₂H₄/C₂H₆). The calculated ratios are used to generate a code, which is then looked up in a table to determine the fault type. The standard also includes the Duval Triangle 1 as a graphical method, which serves as an excellent starting point.
CIGRE TB 771 & IEEE C57.104
Both the CIGRE and IEEE guides strongly advocate for using a full suite of graphical methods as the primary diagnostic tools. The modern diagnostic workflow begins with Duval Triangle 1 for a rapid, high-level fault classification using the relative percentages of CH₄, C₂H₄, and C₂H₂.
If a thermal fault (T1, T2, T3) is indicated, the analyst must then pivot to more advanced tools to gain critical, granular insight. This second step is non-negotiable, as it distinguishes a benign issue like stray gassing ('S') from a severe condition like paper carbonization ('C'), a distinction that Triangle 1 alone cannot make.
Duval Triangles 4 & 5: These tools provide a more detailed diagnosis of thermal faults. Triangle 4 uses H₂, CH₄, and C₂H₆ to distinguish between low-temperature issues like partial discharges (PD), stray gassing (S), overheating (O), and paper carbonization (C). Triangle 5 uses CH₄, C₂H₄, and C₂H₆ to analyze medium-to-high temperature thermal faults.
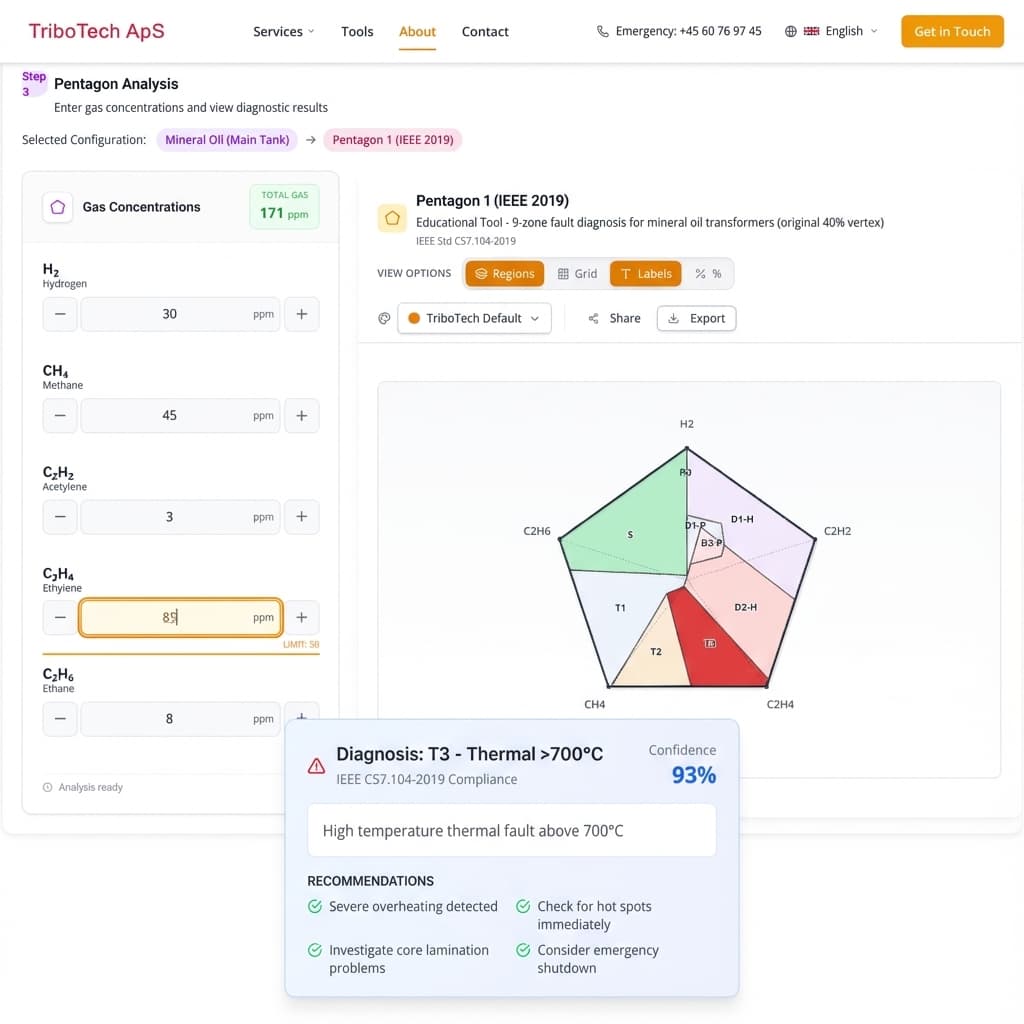
Duval Pentagons 1 & 2: These are the most comprehensive graphical tools, using all five key combustible gases (H₂, CH₄, C₂H₆, C₂H₄, C₂H₂). Pentagon 1 identifies the basic faults plus stray gassing (S). Pentagon 2 provides the most granular diagnosis, breaking down thermal faults into the detailed sub-types (S, O, C, T3-H).
Recent Developments
The Duval graphical methods continue to evolve beyond the three core standards covered in this guide:
Refined Discharge Sub-zones (Duval 2022): Duval and colleagues introduced further refinement of the D1 and D2 discharge zones in IEEE TDEI Vol. 29, No. 6 (Dec 2022) "Update on Duval Triangles and Pentagons" pp. 2231–2238, DOI 10.1109/TDEI.2022.3217313 [VERIFICATION NEEDED — verify exact title, volume, and DOI against IEEE Xplore before publication], distinguishing between high-energy discharges D1-H/D2-H and discharges with partial-discharge involvement D1-P/D2-P. The refinement is incorporated in CIGRE TB 771 (2019) Annex C (informative) and in subsequent Duval Pentagon variants. This granularity helps differentiate between pure arcing events and mixed discharge phenomena.
Unified Pentagon (proposed at CIGRE Colloquium A2, Split 2023, paper TLM_12): A combined Pentagon 1+2 approach was introduced in this colloquium paper — not in an official CIGRE Technical Brochure — streamlining the two-step pentagon workflow into a single comprehensive diagnostic tool while retaining the thermal sub-classification capability.
Alternative Fluid Tools: For transformers using ester-based fluids (natural esters like FR3 or synthetic esters like Midel 7131), dedicated tools have been developed including Triangles 3, 6, and 7, and Pentagons 3, 4, and 4b. These account for the different gassing characteristics of alternative fluids compared to mineral oil.
Automated Unified Diagnosis: Modern software tools now integrate these individual graphical methods into a single, cohesive workflow. The Unified Diagnosis Flow Tool automates the process of combining Triangle 1, Pentagons 1 & 2, and IEC ratios with trend analysis, providing a comprehensive fault summary without manual cross-referencing.
Diagnostic Value
From a diagnostic standpoint, this graphical approach is superior. It provides a powerful, visual way to not only diagnose a fault but also to track its evolution over time on a single chart and identify potential mixtures of different fault types occurring simultaneously.
Try our Duval Triangle Calculator →
Try our Duval Pentagon Calculator →
Experience the Unified Diagnosis Flow Tool →
4. Measuring Urgency: Analyzing the Rate of Gas Increase
Understanding how quickly gases are being generated is just as important as knowing their absolute concentrations. The standards differ in the formality of their approach to this analysis.
IEC/CIGRE
Both frameworks acknowledge the critical importance of gassing rates and provide tables of typical rates (e.g., in ppm/month). However, they offer a less formalized methodology for routine calculation and assessment compared to the IEEE guide.
IEEE C57.104
This guide provides a distinct, two-part methodology for assessing the activity of a fault:
-
Delta (Table 3): This metric represents the change in a gas concentration between two consecutive samples. This value is compared against a 95th percentile norm. If the delta exceeds the norm, it indicates the change is statistically significant beyond normal analytical variability, justifying a confirmation sample to verify the trend.
-
Rate (Table 4): This is a longer-term rate of increase, calculated using a linear best fit of three to six data points over several months. This calculated rate is then compared to norms to confirm an active, ongoing fault. A rate exceeding the norm is a condition for assigning DGA Status 3.
In the field, this means the IEEE method provides a structured, data-driven process that helps asset managers avoid overreacting to minor, insignificant fluctuations in gas readings while reliably identifying persistent, long-term gassing trends that signal an active fault.
5. Is the Paper Involved? Interpreting Carbon Oxides
The involvement of solid insulation (paper) in a fault is a critical concern, and interpreting the role of carbon monoxide (CO) and carbon dioxide (CO₂) is often a source of confusion. The latest IEEE guide provides modern, nuanced guidance that clarifies older interpretations.
Based on the guidance in IEEE C57.104 (Section D.8), the key points for interpreting carbon oxides are:
-
High CO (>1000 ppm) and/or a low CO₂/CO ratio (<3) without significant hydrocarbon gases is typically the result of oil oxidation in sealed transformers. This is not a fault involving paper and is generally not a cause for alarm.
-
High CO and a low CO₂/CO ratio together with significant hydrocarbon gases may indicate that paper insulation is involved in the fault. However, this is not definitive and requires confirmation using other tools. An analyst should check Duval Pentagon 2 for a fault point in the 'C' (Carbonization) zone, analyze for furanic compounds, or use other diagnostic markers to confirm paper degradation.
-
Very high CO₂ concentrations (>10,000 ppm) paired with a high CO₂/CO ratio (>10) can suggest mild, low-temperature overheating of paper (below 160°C).
This practical guidance is invaluable for preventing false alarms. By helping to distinguish benign oil oxidation phenomena from true paper degradation, it ensures that maintenance resources are focused on confirmed risks to the asset's health.
For a complete overview of oil quality testing beyond DGA—including water content, acidity, and interfacial tension—see our introductory guide: What Your Transformer Oil Is Trying to Tell You.
For a deeper exploration of paper insulation assessment—including why traditional DP thresholds may not be the "death sentence" once believed—see: Rethinking 'End-of-Life': Is a Low DP Score Really a Death Sentence?.
6. When the Oil Itself Gasses: The Stray Gassing Question
Before escalating a DGA result, the analyst needs to ask a question that most interpretation tables will not answer directly: is this gas coming from a fault — or from the oil itself?
A subset of mineral insulating oils generate measurable hydrogen, methane, ethane and occasionally ethylene simply by being exposed to normal operating temperatures, with no fault present. This is stray gassing, and it is formally recognised as fault sub-type 'S' in the CIGRE TB 771 fault classification and is now characterised through laboratory protocols consolidated in CIGRE TB 927:2024 (WG D1.70).
Stray gassing matters to the workflow above for three reasons:
- It can push healthy units into IEEE DGA Status 2 or 3 when oil chemistry alone drives H₂ or CH₄ past the 90th/95th percentile norm. The IEEE Status then flags a unit correctly per the standard — but the underlying phenomenon is not a fault.
- It lives in a specific Duval zone (S) — inside Triangle 4 and Pentagon 1/2. If the deep-diagnosis step lands in the S zone, you are looking at an oil property, not an incipient fault.
- It is the single most common source of DGA false alarms, and the asymmetric cost of misreading it as PD or a thermal fault — unplanned de-energisation, retanking, loss of trust in the monitoring programme — is what separates a seasoned diagnostician from a junior one.
Two quick rules of thumb when stray gassing is suspected:
- Hydrocarbons rise but CO and CO₂ do not, and no acetylene is present → stray gassing is a plausible explanation and warrants a Triangle 4 / Pentagon 2 check before escalation.
- Recent oil change, top-up, or reclamation → elevated hydrogen and methane in the first months can be stray gassing from the new oil batch, not a transformer fault.
When in doubt, characterise the oil batch (IEC 60296 stray-gassing test) before acting on a DGA escalation. The full mechanism, laboratory methodology and interpretation guidance are covered in the dedicated post: Stray Gassing: When Your DGA Report Is Telling You Nothing (and That's Useful to Know).
7. Guidance for Specialized Equipment
The standards recognize that different types of oil-filled equipment have unique gassing characteristics. Applying main tank criteria to these components can lead to misdiagnosis.
On-Load Tap-Changers (OLTCs)
IEC 60599 notes the risk of acetylene contamination from a communicating OLTC into the transformer's main tank. For diagnosing the OLTC compartment itself, CIGRE documentation describes the use of Duval Triangle 2. This specialized tool has unique zones for "Normal" operation (N, N1, N3, etc.) that account for the gassing produced during routine switching operations.
Tap changers are not a minor concern: TB 939 attributes 19 % of all surveyed major failures to the tap changer (Figure 26, p. 51), and 21 % of substation-transformer failures specifically (§6.3.2, p. 51).
Bushings
According to IEC 60599 and CIGRE TB 771, bushings frequently exhibit much higher typical gas values than the main tank, especially for hydrogen, which is often generated by stray gassing. Specific typical value tables (often based on the 95th percentile) and fault interpretation schemes exist for bushings and must be used to avoid misinterpreting normal bushing gassing as a fault.
Bushing failures have risen proportionally in the most recent reliability survey — from roughly 12 % of failure locations in the previous WG A2.37 data to 25 % in TB 939 (2024) (Figure 36, p. 60). Where bushing DGA is available, it is an increasingly important signal to treat with its own thresholds.
Wind Turbine Transformers (WTTs)
IEC 60599 and CIGRE TB 771 describe wind turbine transformers as having elevated typical gas values versus conventional substation transformers, with corona-type partial discharges (PD) and low-temperature thermal faults (T1) commonly observed due to their cyclic loading and compact design. WTTs accordingly have their own set of typical values, and main-tank thresholds should not be applied blindly to them.
Summary: Key Differences at a Glance
This table provides a concise summary of the key philosophical and methodological differences between the three major DGA interpretation frameworks.
| Feature / Philosophy | IEC 60599:2022 | IEEE C57.104-2019 | CIGRE TB 771 |
|---|---|---|---|
| Threshold Concept | Single "Typical Value" threshold (90th percentile) to define a "fault". | Tiered "DGA Status" (1, 2, 3) based on 90th and 95th percentile norms. | Single "Typical Value" threshold (90th percentile). Introduces multiple levels above typical (Intermediate, Pre-failure). |
| Fault Classification | 6 basic types (PD, D1, D2, T1, T2, T3). | 6 basic types, but incorporates CIGRE sub-types via graphical tools. | 6 basic types plus detailed thermal sub-types (S, O, C, T3-H). |
| Primary Diagnostic Tool | Basic Gas Ratios table; Duval Triangle 1. | Duval Triangles (1, 4, 5) and Pentagons (1, 2). | Duval Triangles (1, 4, 5) and Pentagons (1, 2). |
| Rate of Increase (ROG) | Acknowledged, with typical rates provided. | Formalized two-step process: Delta (short-term significance) and Rate (long-term trend). | Acknowledged, with typical, intermediate, and pre-failure rates. |
| CO/CO₂ Interpretation | High CO₂/CO ratio (>10) suggests mild paper overheating. | High CO without hydrocarbons is likely oil oxidation. Requires hydrocarbons + other indicators to confirm paper fault. | Carbonization ('C' fault) is identified graphically with hydrocarbon-based tools (Triangle 5, Pentagon 2). |
| Special Equipment | Annexes for bushings, WTTs, OLTCs. | References other standards and CIGRE guidance. | Detailed sections and specific tools (e.g., Duval Triangle 2 for OLTCs). |
A Best-Practice Diagnostic Protocol

Based on this unified approach, here is a prescriptive, step-by-step protocol for modern DGA interpretation:
Step 1: Triage with IEEE DGA Status
Use the IEEE Status model (1, 2, 3) as your primary action framework. This creates a structured response plan, moving from routine monitoring (Status 1) to increased surveillance (Status 2) and finally to in-depth investigation (Status 3), helping you prioritize resources effectively.
Step 2: Diagnose with the Duval Graphical Suite
While IEC ratios are foundational, the Duval Triangles and Pentagons are your primary diagnostic tools. Begin with Triangle 1 for a high-level diagnosis, then immediately use Triangles 4/5 and Pentagon 2 to refine the fault type. This step is essential to distinguish between stray gassing, oil-only overheating, and paper carbonization.
Step 3: Validate Gassing Trends with IEEE Methodology
Implement the IEEE "Delta" and "Rate" calculations to confirm active gassing. Use the "Delta" to determine if a change between two samples is significant enough to warrant a confirmation sample, and use the long-term "Rate" to confirm a persistent, ongoing fault.
Step 4: Rule Out Stray Gassing Before Escalation
When the deep-diagnosis step lands in the 'S' zone of Triangle 4 or Pentagon 2 — or when hydrocarbons are elevated without any CO/CO₂ response and without acetylene — consider stray gassing as a first hypothesis, especially for recently topped-up or reclaimed oil. An oil-batch stray-gassing characterisation per IEC 60296 / CIGRE TB 927 can save an unnecessary intervention. See the dedicated stray gassing guide for the full workflow.
Step 5: Scrutinize Paper Fault Indicators
Before diagnosing a paper fault based on CO/CO₂ ratios, always follow the IEEE recommendation and check for the presence of significant hydrocarbon gases. If hydrocarbons are low, the cause is far more likely to be benign oil oxidation. Use tools like Pentagon 2 to confirm a 'C' zone fault.
Step 6: Apply Equipment-Specific Context
Always consider the equipment type. Use the specific guidance and typical values from CIGRE and IEC for bushings, OLTCs, and wind turbine transformers to avoid misdiagnosis. Remember that what's "normal" for a bushing is a clear fault indicator for a main tank — and that bushings now account for a quarter of all reported major failures (CIGRE TB 939:2024).
Step 7: Refine Norms for Your Fleet
As recommended by IEEE, use the provided percentile values as a starting point, but work toward developing your own typical values based on your specific transformer population, age, and operating conditions. This will provide the most accurate screening and triage for your assets.
Conclusion: A Unified Vision for DGA Interpretation
Ultimately, a master diagnostician does not choose a single standard; they orchestrate them. An asset's DGA profile is first triaged against IEEE's Status thresholds to establish urgency and dictate the response timeline. If an investigation is warranted (Status 2 or 3), the powerful graphical diagnostics of the CIGRE-developed Duval Triangles and Pentagons become the primary tool to pinpoint the fault's precise nature, moving far beyond the initial clues offered by older IEC ratio methods — and the stray-gassing question is explicitly asked before escalation.
The goal is not rigid adherence to one set of rules, but a holistic understanding that combines data from all frameworks to build a complete and reliable picture of asset health. The latest CIGRE reliability survey (TB 939:2024) is a reminder of why: most major transformer failures are still detected only when the unit trips, which means the pre-trip window that DGA is designed to cover is a window many programmes are still not fully using.
The art of DGA lies not in choosing one tool, but in knowing how to use them all.
Need expert help interpreting challenging DGA results? TriboTech's specialists have analyzed tens of thousands of samples across every fault type. Contact us for expert consultation.
References
- IEC 60599:2022 — Mineral oil-filled electrical equipment in service — Guidance on the interpretation of dissolved and free gases analysis. IEC webstore.
- IEEE C57.104-2019 — IEEE Guide for the Interpretation of Gases Generated in Mineral Oil-Immersed Transformers. IEEE standards.
- CIGRE Technical Brochure 771 (2019) — Advances in DGA Interpretation, WG D1.32. e-cigre.org.
- CIGRE Technical Brochure 927 (2024) — New Laboratory Methodologies for Investigating Insulating Liquids: Further Developments in Key Functional Properties, WG D1.70.
- CIGRE Technical Brochure 939 (2024) — Analysis of AC Transformer Reliability, WG A2.62. e-cigre.org. ISBN 978-2-85873-644-7.
- M. Duval and L. Lamarre (2014+) — Duval Triangles 4 and 5, Pentagons 1 and 2, and subsequent refinements of discharge sub-zones (IEEE and CIGRE papers).
Put Theory into Practice
Try our interactive Duval diagnostic tools or use our new unified workflow to analyze your transformer oil data.